Cincinnati Neighborhoods Statistics Explorer
The Cincinnati Enquirer, in an effort to help the city’s residents better understand their city and its neighborhoods, compile statistical information from a wide range of sources, then turn to us to come up with a way of presenting it. One of our designer’s roughed out and look for the project, and I built it in Svelte, powered by a Google spreadsheet.
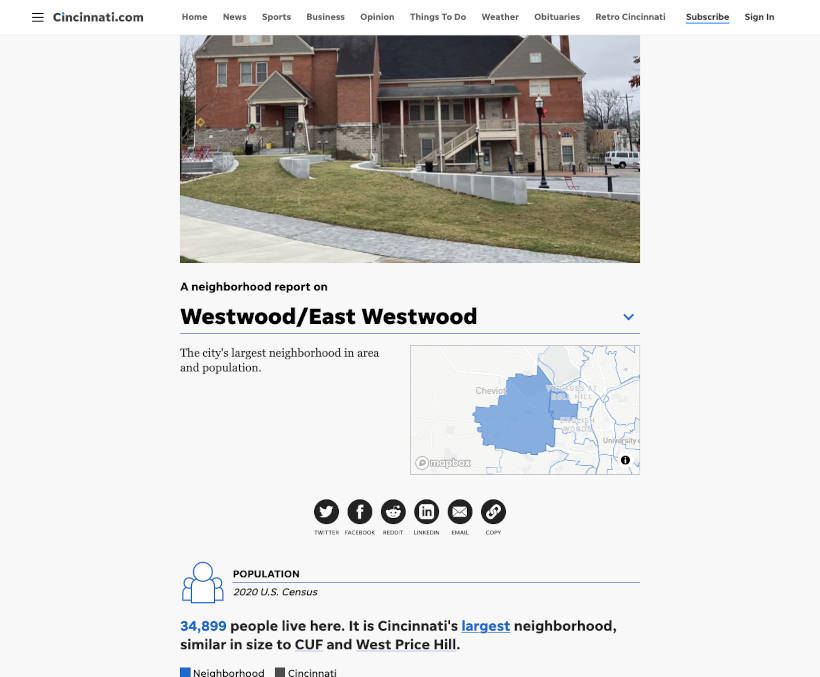
The app groups information by either metric — race, income, education, etc. — or by neighborhood. I built custom dropdown components for either case and templates to handle both. The metrics template presents a list ranking the neighorhoods by the selected metric, along with a simple chart-like graphic to show distribution. The neighborhood template displays selected metrics as a narrative, highlighting the important numbers, accompanied by bar charts, pie charts and waffle charts.
Cincinnati Neighborhoods